Houston, Texas · Owner-operated proptech · Est. on our own portfolio

Buildings that optimize —
and prove — themselves.
Every day.

BOT runs one continuous loop — RMS measures, the Atenea BAS controls, Ada optimizes — on our own commercial portfolio, verified every 15 minutes against a weather-normalized baseline. First we cut our own bills roughly in half. Then we license the platform that did it.

0 SF
operated & instrumented
0+ yrs
below-CPI operating expenses
~0%
verified energy reduction
0
M&V baseline accuracy
Continuous verification · actual vs. CMV2.0 baseline · 15-min intervals
CAL. PLATE — IPMVP OPT. C · CV(RMSE) ≈ 14.9% · NMBE ≈ −0.08% · R² ≈ 0.96
baseline (expected) — kW
actual — kW
verified gap — kW saved
the green area is the product: savings, proven every interval
Sec. 01 · The scoreboard

The bill is the scoreboard.
It has four levers.

Nearly half of a Texas commercial electric bill is not the kWh line. Demand, the four ERCOT coincident peaks, and power factor each price a different behavior — so BOT plays four games, not one. Click a lever to see which measures pull it.

Anatomy of the bill — hover a segment

ENERGYkWh
DISTRIBUTIONNCP
TRANSMISSION4CP
PF+kVA
Shares are illustrative for a Houston multi-tenant office. The point: each color is a separate game with its own strategy document, its own physics, and its own payday.
Sec. 02 · The machinery

Three platforms.
One loop. No end date.

A ranked list of measures is only a promise. Savings become real — and stay real — when a platform executes them, watches them, and verifies them continuously. Ours does, every 15 minutes.

RMS
Renaissance Management Suite — sense & verify
The energy system of record. Interval meters, utility bills, and 2,000+ energy databases across the portfolio, holding the weather-normalized CMV2.0 baselines that define what every building should use — hour by hour.
Atenea BAS
Building automation fabric — control
The hand at the equipment. Distributed controllers, relays, VFD links, and VAV/FPTU terminal control that actually execute the measures — schedules, resets, staging, curtailment — at fans, pumps, chillers, and zones.
Ada
Daily optimization intelligence — optimize
The head that decides. An on-premise AI that reads RMS, the BAS, weather, and the ERCOT 4CP-risk forecast, sets each day's plan, drives the BAS, and verifies the result — narrating every decision in English or Spanish.
CMV2.0 — the shared yardstick
IPMVP Option C · weather-normalized · CV(RMSE) ≈ 14.9% · NMBE ≈ −0.08% · R² ≈ 0.96 — accurate enough to defend a savings number, not just illustrate one.
CONTINUOUS energy mgmt & verification SENSERMS CONTROLAtenea BAS OPTIMIZEAda VERIFYCMV2.0
1 · Sense
Meters, occupancy, and every BAS point stream into RMS — the building's live state, every 15 minutes.
2 · Control
The Atenea BAS executes the measures at the equipment: schedules, resets, staging, terminal minimums, curtailment.
3 · Optimize
Ada reads weather, occupancy, and 4CP risk, then sets the day's plan — setpoints, start times, demand budget.
4 · Verify
RMS scores actual against the CMV2.0 baseline and flags drift the moment it opens — then the loop turns again.
Sec. 03 · The playbook

The apparatus pipeline —
ranked by payback, mapped to the bill.

A foundation, fifteen measures, the zone delivery layer, and the brain that runs them — in retrofit order, most savings first. Dots show which bill levers each measure pulls: filled = primary, open = secondary.

Savings ranges are typical industry figures within each measure's own category (fan energy, lighting energy, plant energy…) — depth of impact, not shares of one total. Every one is executed by the Atenea BAS and verified in RMS against CMV2.0.

Zone thermal map · Flagship asset

800 Wilcrest Dr

A 65,564 SF Class A office building in Houston's Westchase district, built in 1983 and owner-operated by G&W Holdings since 2007 — the asset BOT was proven on. Every rooftop unit, meter and relay here runs on the same loop we license: RMS measures it, the Atenea BAS controls it, Ada optimizes it, and CMV2.0 verifies every 15 minutes against a weather-normalized baseline.

Between 2015 and 2025 this building's annual energy use fell roughly 50% (time-normalized) — first by ending schedule waste and moving the rooftop units to gas heat, then by a further ~25% year-over-year after our own BAS beta went in around March 2025. No comfort was traded away for it. The model beside this text is the building's own geometry, shaded the way we read it: blue where a zone is running cool, red where it is running hot. The field shown is illustrative — once this building's Atenea BAS feed is connected, the same surface carries live zone temperatures.

65,564SF · Class A
1983Built · Westchase
2007Owner-operated since
~50%Energy cut 2015–2025
BOT // ZONE THERMAL MAP Demo field drag to orbit
CoolHot Zone temperature · illustrative field pending the Atenea BAS feed — not live readings.
Measured results · our own buildings

Not projections. The meter.

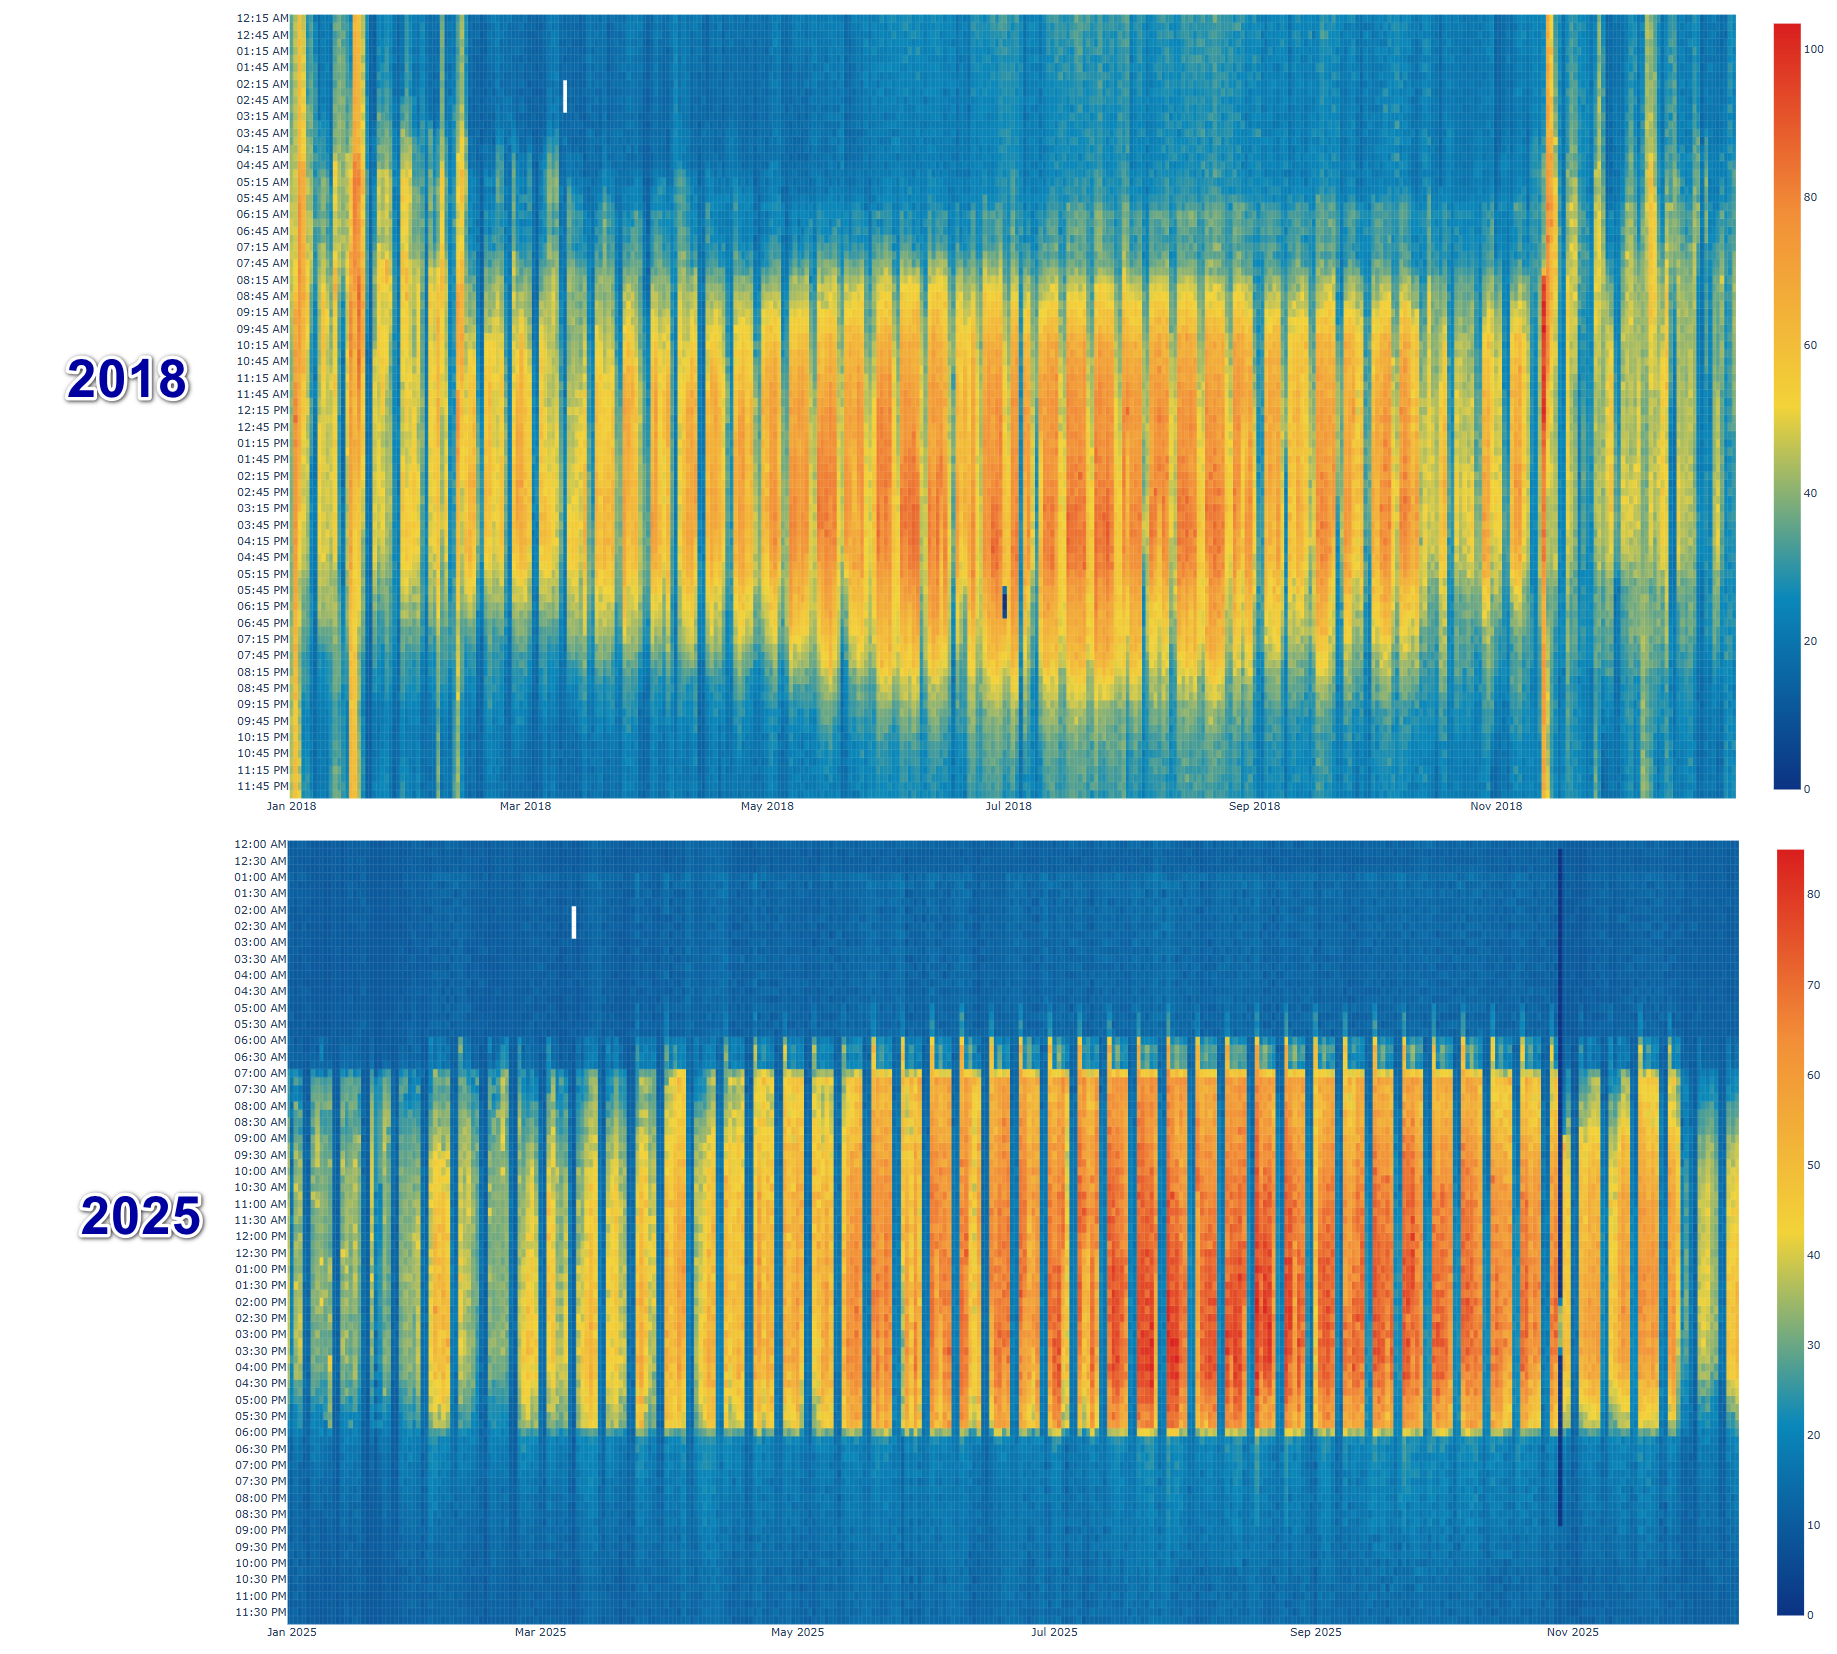
These are our own two buildings, straight from the interval data — the same software and loop we license. No models, no estimates: the readings before and after.

11104 West Airport Blvd — kWh interval heat map, 2018 vs 2025 ↓ Download image
Energy heat map of 11104 West Airport Blvd: 2018 shows energy smeared around the clock with no night setback; 2025 shows a tight, uniform daily schedule.
2018, at acquisition (top): energy running around the clock — no overnight setback, weekend waste, warm bands bleeding into the night. 2025 (bottom): a tight, uniform schedule — sharp on around 7 AM, off by 6 PM, near-zero overnight and weekends. Same building, same comfort, a fraction of the waste.
Roughly 50% Less Energy at 800 Wilcrest, 2015–2025 ↓ Download image
Bar chart of monthly kWh at 800 Wilcrest Dr; the 2025 bars run roughly half the 2015 and 2016 baseline years.
Time-normalized monthly kWh at 800 Wilcrest. The 2025 bars run roughly half the 2015–2016 baseline — month after month, the ~50% reduction on the meter. Time-normalized, not weather-normalized.

Wow that's incredible. RMS helped me to find this as soon as I came over to Katy ISD in Sept of 2022.

JAY BONHAM · KATY ISD
THE NUMBER BEHIND IT — CMV2.0 M&V
MAYDE CREEK COMPLEX MAIN · 932,364 SF · KATY ISD
BASE YEAR 2022 → TARGET JAN 2023 – FEB 2026
WEATHER-NORMALIZED (KHOU) · AI BASELINE VS ACTUAL
NET SAVINGS 6,900,674.85 kWh · ≈ 18.01%
Sec. 04 · Skin in the game

We proved it on our own
buildings first.

BOT is an owner-operator: four Houston office properties, ~421,000 SF, instrumented end-to-end. 19+ years of below-CPI operating expenses and roughly 50% energy reduction at our flagship — held, not decayed, because verification never stops. The platform is the product.

OWN & RUN
Four properties, one operator, every meter and relay on the stack.
PROVE & VERIFY
Every lever, every interval, against the CMV2.0 baseline.
LICENSE
The same RMS + BAS + Ada loop, deployed on your portfolio.
installyr 1yr 2yr 3yr 4 with the loop — savings held one-time audit — savings decay protected value
Retro-commissioning is a photograph. The loop is a live feed — overrides, drift, and quiet reversions get caught the interval they appear, so the savings curve stays flat instead of bleeding out.
CV(RMSE) ≈ 14.9%
baseline model error, portfolio-validated
NMBE ≈ −0.08%
net bias — effectively zero
10–30%
typical transmission reduction from disciplined 4CP response
±16 min
ErcotLoad peak-window timing accuracy, ~50% day-hit at 3 calls/mo
Sec. 05 · The daily brain

Meet Ada.

Ada is BOT's on-premise operations intelligence — she runs on our own hardware, so your building's data never leaves the building. Every morning she reads the meters, the weather, and the ERCOT 4CP risk; plans the day; drives the Atenea BAS; and closes the evening by verifying the result against the baseline.

  • Plans — start times, setpoints, demand budget, curtailment windows.
  • Executes — through the same relay and VFD fabric that runs the pipeline.
  • Verifies — actual vs. CMV2.0, every interval, drift flagged same-day.
  • Explains — every decision narrated in plain language, English or Spanish.
Ada · daily briefing · 06:00
Good morning. ErcotLoad puts today's 4CP risk at 72% — window 16:15–17:30. I'm pre-cooling floors 3–5 from 13:00 and holding chiller 2 through the window; banked cooling carries comfort.
Yesterday closed 7.9% under baseline — verified. One flag: AHU-3N's schedule reverted after the holiday; I restored it at 05:12 before it cost the morning.
Buenos días. Riesgo 4CP de hoy: 72%, ventana 16:15–17:30. Pre-enfriamiento desde las 13:00; el ahorro de ayer quedó verificado contra la línea base.
Sec. 06 · The strategy series

One strategy, documented
lever by lever.

The whole approach is written down — a master billing document, one chapter per lever, the ranked pipeline, and the platform brief. Available to owners, partners, and licensees.

Free trial · No hardware required

Visualize your own data
in RMS.

All we need is a recent utility bill to get started. We load your own interval data into the Renaissance Management Suite and show you what's hiding in it — the after-hours drift, the peak that sets your demand charge, the weather-driven load that isn't your fault. No hardware, no install.

Sec. 07 · Start the loop

Prove your building.

Send us twelve months of interval data and we'll return the four-lever read: where your kWh, NCP, 4CP, and power-factor money is going — and what the loop would hold onto. No capital required to start; conservation begins with a schedule.

CompanyBuilding Optimization Technologies, LLC · G&W Holdings
Base800 Wilcrest Dr, Houston, TX 77042
Webbot.bldgopttech.com
Request the four-lever read