Measured results · our own buildings
Not projections. The meter.
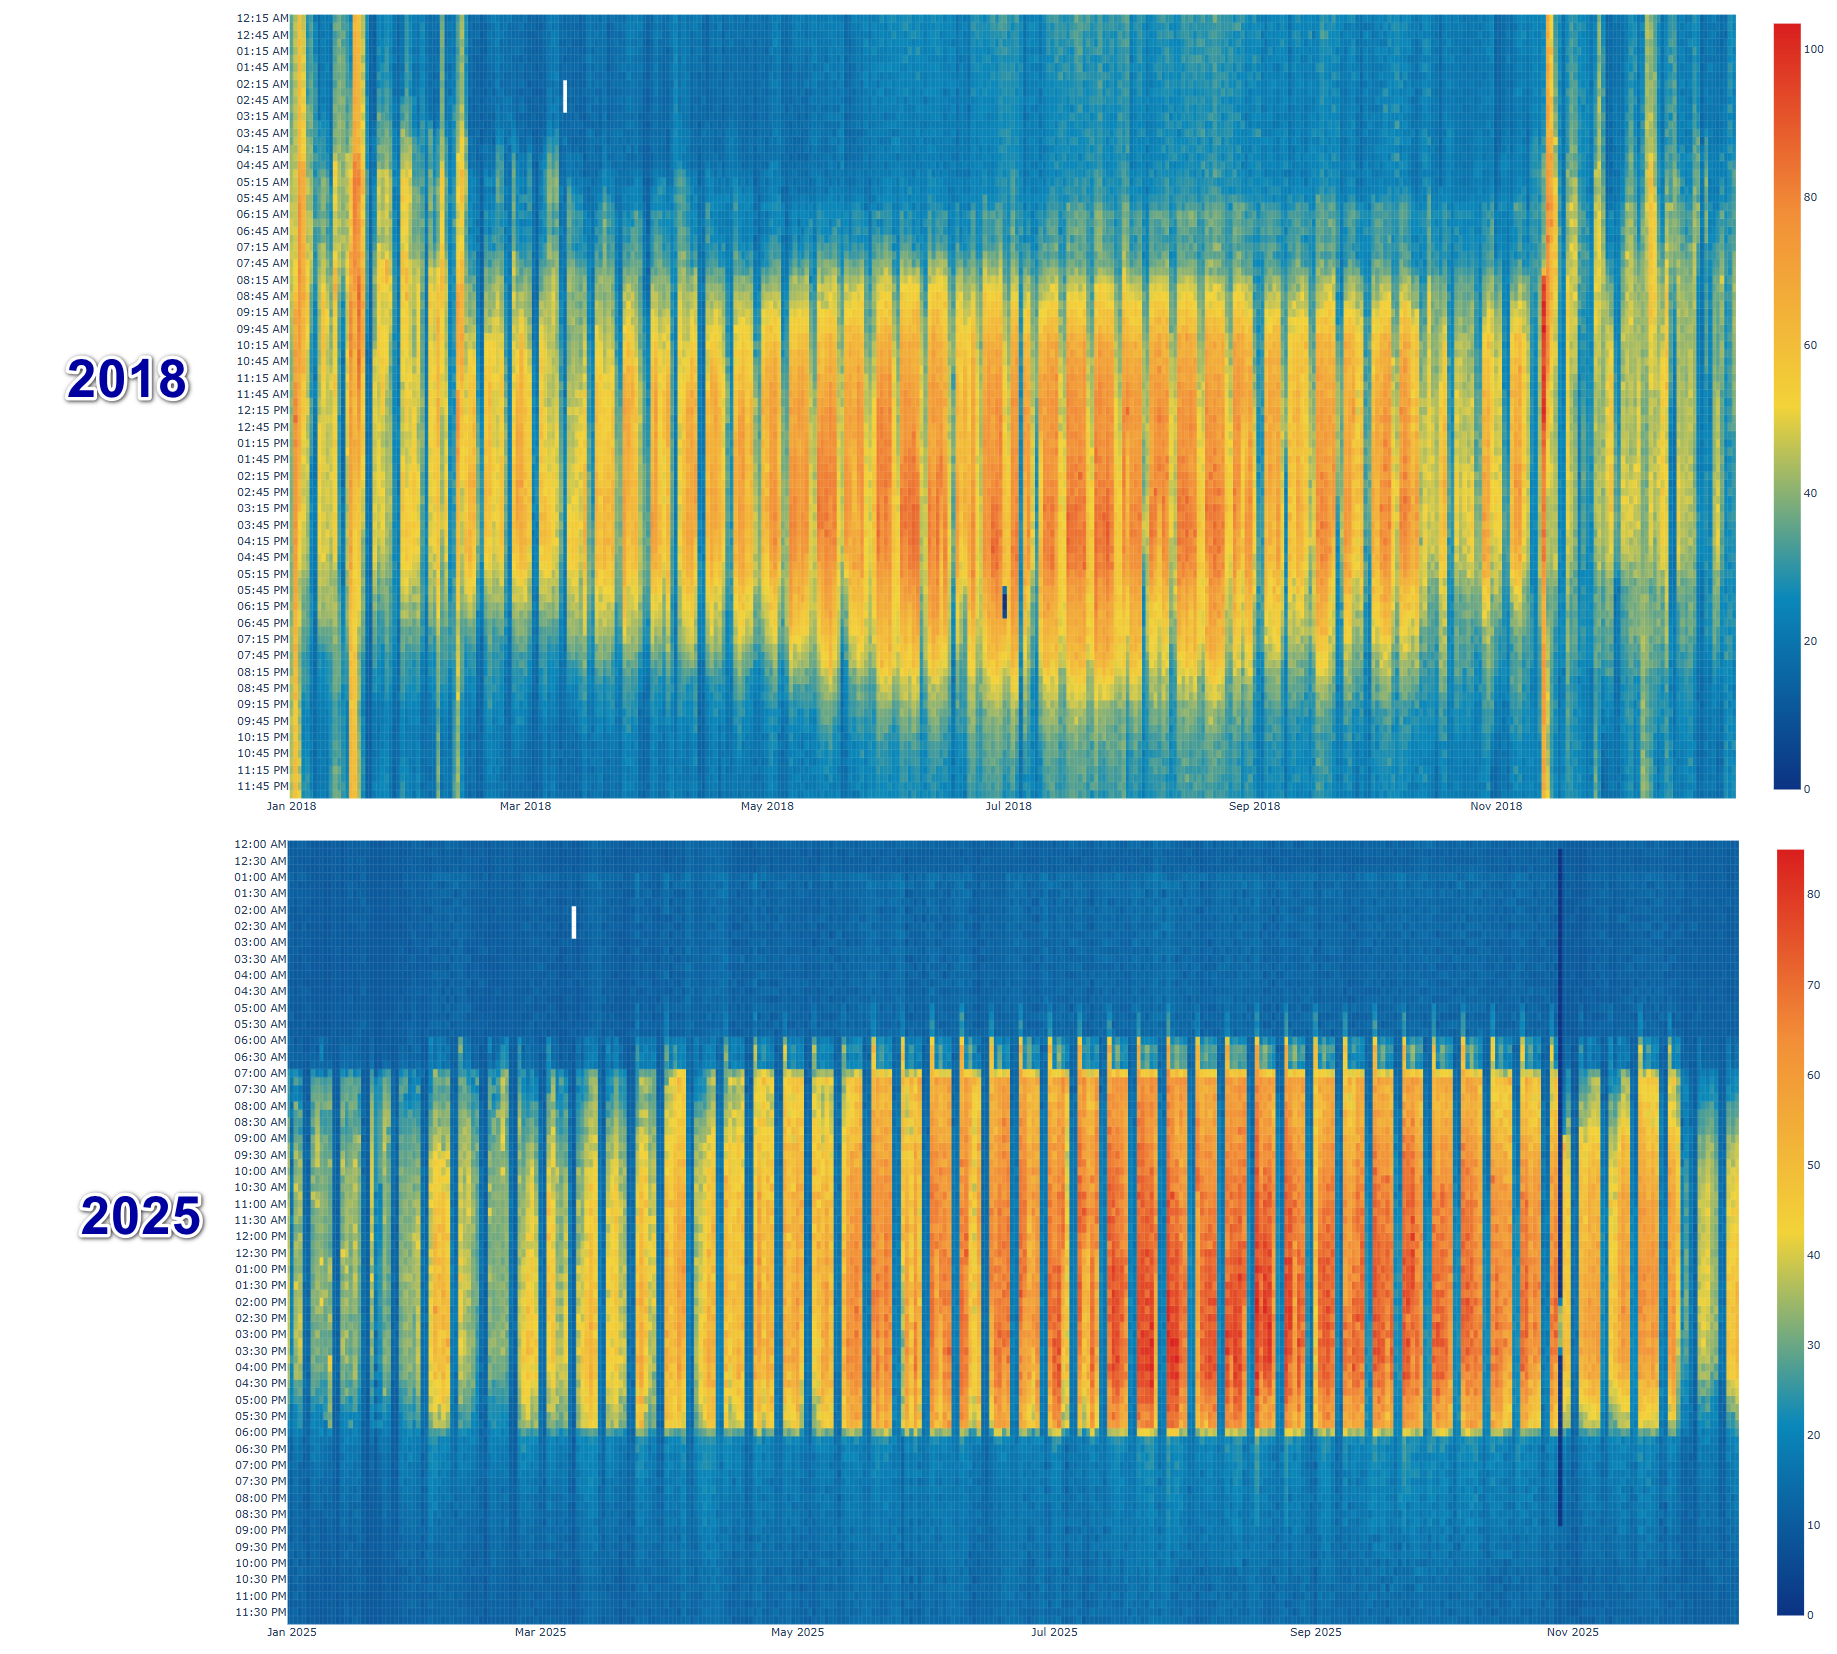
These are our own two buildings, straight from the interval data — the same software and loop we license. No models, no estimates: the readings before and after.

RMS is the software platform Building Optimization Technologies uses to help schools, counties and organizations cut energy waste and lower costs. It collects and analyzes your smart-meter and weather data automatically, detects faulty HVAC and inefficiencies in real time, and puts it all in interactive dashboards. No hardware required.
Building Optimization Technologies, LLC (BOT) helps schools, counties and organizations cut energy waste and lower costs through our software platform, the Renaissance Management Suite™ (RMS). Here is what it does, without anyone having to remember to do it.
Smart meter and weather data, ingested and analysed automatically — no manual data wrangling.
Faulty HVAC systems and inefficiencies surfaced in real time, while they're still costing you money.
Interactive dashboards for faster decisions — the data arranged so the answer is visible.
Reduces costs while supporting sustainability goals — the same number, counted two ways.
Your meters are already producing a reading every fifteen minutes. That's roughly 35,000 numbers per building per year — a spreadsheet nobody opens. RMS reads all of it, every day, and tells you the three things that changed.
Independent studies show 8–20% energy savings across schools, offices, hospitals, and campuses when using Energy Management Information Systems (EMIS). RMS takes this further by removing hardware costs and simplifying access.
We quote the range, not the ceiling. What your building actually returns depends on its characteristics, tariffs, weather, occupancy and operating discipline — which is exactly why RMS measures yours instead of assuming a number. When BOT needs to prove a figure rather than estimate it, the analysis runs under IPMVP Option C continuous M&V.
These are our own two buildings, straight from the interval data — the same software and loop we license. No models, no estimates: the readings before and after.
Wow that's incredible. RMS helped me to find this as soon as I came over to Katy ISD in Sept of 2022.
Granular energy data plus rich weather context equals clearer root causes, quicker fixes, and measurable savings. Both feeds are automatic.
RMS automatically ingests 15-minute interval data from your smart meters to reveal precise usage patterns.
RMS blends in hourly weather from 300+ airports to explain what's driving your loads.
Granular energy data + rich weather context = clearer root causes, quicker fixes, and measurable savings.
RMS delivers powerful, building-level insights — helping you visualize energy use, detect anomalies, and uncover savings opportunities.
RMS shows its full strength when managing 100+ facilities — giving you rich, interactive visuals to track energy, detect inefficiencies, and make smarter decisions.
Guided learning is built in: every feature above links to its own walkthrough. These are the rest — the dashboard itself, the interactive controls, and the issue-tracking flow.
Every feature includes info-icons and tutorial videos for step-by-step help.
New users get a quick start with video guides and dedicated support.
Our team is always available to ensure you get the most from RMS.
Visualize your own data in the RMS app. All we need is a recent utility bill to get started.
That's the entire onboarding ask for the free trial. We'll load your own interval data into RMS and show you your building in the dashboards — the after-hours drift, the peak that set your demand charge, the load the weather explains and the load it doesn't.